Pages

Tuesday, December 14, 2010

MATLAB PROGRAM TO IMPLEMENT DISCRETE FOURIER TRANSFORM

%DFT
close all;
clear all;
N=input('Howmany point DFT  do you want?');
x2=input('Enter the sequence=');
n2=length(x2);
c= zeros(N);
x2=[x2 zeros(1,N-n2)];
 for k=1:N
     for n=1:N
         w=exp((-2*pi*i*(k-1)*(n-1))/N);
         %prev.step=>evaluating w-matrix
         x(n)=w;
     end
     c(k,:)=x;
 end
 r=[c]*[x2']
 %plotting magnitude and angle
subplot(211)
stem(abs(r));
title('DFT-absolute value');
subplot(212)
stem(angle(r));
title('DFT-angle');
 
OUTPUT WAVEFORM 

Monday, December 13, 2010

MATLAB PROGRAM TO DISPLAY THE PROPERTIES OF DISCRETE FOURIER TRANSFORM (DFT) - LINEARITY PROPERTY

%DFT linearity property
close all;
clear all;
N=input('Howmany point DFT  do you want?');
x1=input('Enter the first sequence=');
x2=input('Enter the second sequence=');
a=input('Enter the first constant a=');
b=input('Enter the second constant b=');
n1=length(x1);
n2=length(x2);
c=zeros(N);
x1=[x1 zeros(1,N-n1)];%make both x1 and x2 
x2=[x2 zeros(1,N-n2)];%of same dimension
x3=a*x1
x4=b*x2
x5=x3+x4 %a*x1+b*x2
for k=1:N
     for n=1:N
         w=exp((-2*pi*i*(k-1)*(n-1))/N);
         %prev.step=>evaluating w-matrix
         x(n)=w;
     end
     c(k,:)=x;  %Every row of w-matrix is inserted &
end             %finally c becomes the w matrix
                %for n-point DFT

 r1=c*x1';   %x1(k)   
 r2=c*x2';   %x2(k)
 R3=a*r1+b*r2  %a*x1(k)+b*x2(k)
 R4=c*x5'      %DFT of a*x1(n)+b*x2(n)
 %plotting magnitude and angle
subplot(211)
stem(abs(R4));
title('DFT of {a*x1(n)+b*x2(n)}');
subplot(212)
stem(angle(R3));
title('DFT of {a*x1(k)+b*x2(k)}');

 
OUTPUT WAVEFORM


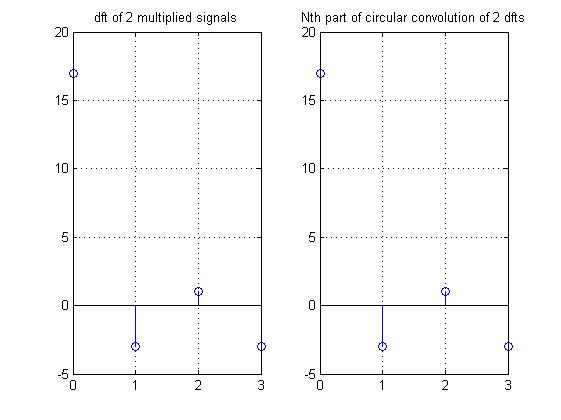
MATLAB PROGRAM TO DISPLAY THE PROPERTIES OF DISCRETE FOURIER TRANSFORM (DFT) - MULTIPLICATION PROPERTY

%multiplication property x1(n)*x2(n)=(1/N)*circonv(X1(k)*X2(k))
clear all;
x1=input('enter the sequence=');
x2=input('enter the second seq of same length=');
N9=input ('enter the number of samples=');
x3=(x1).*(x2);  %multiplication of 2 signals
x4=fft(x1,N9);%dft of first seq
N1=length(x4);%length of sequence
x5=fft(x2,N9);%dft of secnd sequence
N2=length(x5);%length of second sequence
%finding circonvolution of 2 signals
x=x4;
h=x5;
N1=length(x);
N2=length(h);
N=max(N1,N2);
x=[x zeros(1,N-N1)];
h=[h zeros(1,N-N2)];
for n=0:N-1
    y(n+1)=0;
    for i=0:N-1
        j=mod(n-i,N);
       y(n+1)=y(n+1)+x(i+1)*h(j+1);
    end
end
y=y/N;   %rhs
x6=fft(x3,N);   %lhs
n=0:1:N-1;
subplot(121);
stem(n,x6);
title('dft of 2 multiplied signals');
grid on;
subplot(122);
stem(n,y);
title('Nth part of circular convolution of 2 dfts');
grid on;
 
OUTPUT WAVEFORM 

MATLAB PROGRAM TO IMPLEMENT THE PROPERTIES OF DISCRETE FOURIER TRANSFORM (DFT) - FREQUENCY SHIFT PROPERTY

%dft frequecy shift property
close all;
clear all;
N=input('how many point dft do you want?');
x1=input('enter the seq');
n2=length(x1);
c=zeros(N);
x1=[x1 zeros(1,N-n2)];
for k=1:N
    for n=1:N
        w=exp((-2*pi*i*(k-1)*(n-1))/N);
        x(n)=w;
    end
    c(k,:)=x;
end
disp('dft is ');
r=c*x1';
a1=input('enter the amount of shift in frequency domain');
for n=1:N
    w=exp((2*pi*i*(n-1)*(a1))/N);
    x2(n)=w;
end
r1=x2.*x1;
subplot(221);
stem(abs(r));
grid on;
title('orginal dft magnitude plot');
subplot(222);
stem(angle(r));
grid on;
title('orginal dft angle');
for k=1:N
    for n=1:N
        w=exp((-2*pi*i*(k-1)*(n-1))/N);
        x(n)=w;
    end
    c(k,:)=x;
end
disp('dft is');
r2=c*r1';
subplot(223);
stem(abs(r2));
grid on;
title('shifted dft magnitude');
 subplot(224);
 stem(angle(r2));
 grid on;
 title('shifed dft angle');

 
OUTPUT WAVEFORM


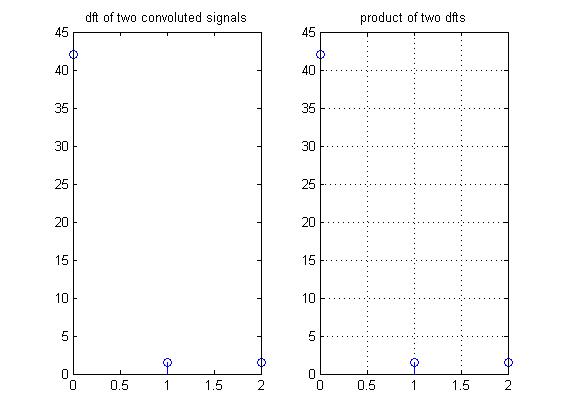
MATLAB PROGRAM TO IMPLEMENT THE PROPERTIES OF DISCRETE FOURIER TRANSFORM (DFT) - CONVOLUTION PROPERTY


clear all;
x= input ('enter the first sequence');
h= input ('enter the second sequence');
No=input('number of samples?');
N1= length(x);
N2= length(h);
N=max(N1,N2);%length of sequence
x=[x zeros(1,N-N1)];  %modified first sequence
h=[h zeros(1,N-N2)];  %modified second sequence

for n=0:N-1;
    y(n+1)=0;
    for i=0:N-1
       j=mod(n-i,N);
       y(n+1)=y(n+1)+x(i+1)*h(j+1);  %shifting and adding
    end
end
n=0:1:No-1;
x4=fft(x);
x5=fft(h);
x6=fft(y);
%seq 2
subplot(121)
stem(n,x6);
title('dft of two convoluted signals');
x7=(x4).*(x5);%product of two dfts
subplot(122);
stem(n,x7);
title('product of two dfts');
grid on;
 
 
OUTPUT WAVEFORM 


MATLAB PROGRAM FOR DISPLAYING A COMPLEX EXPONENTIAL WAVE

%exponential wave
t=0:0.1:10;
s=0.1+1i;%complex number
y=exp(s*t);%expression for complex exponential
stem3(real(y),imag(y),t,'r');
%to show the 3d graph
%'r'indicates the colour-red
view(-39.5,42);%azimuth and elevation
xlabel('real');
ylabel('imag');
zlabel('amplitude');
title('complex exponential');
rotate3d;%to rotate in 3-dimensions
legend('complex exponential');
 
OUTPUT WAVEFORM 

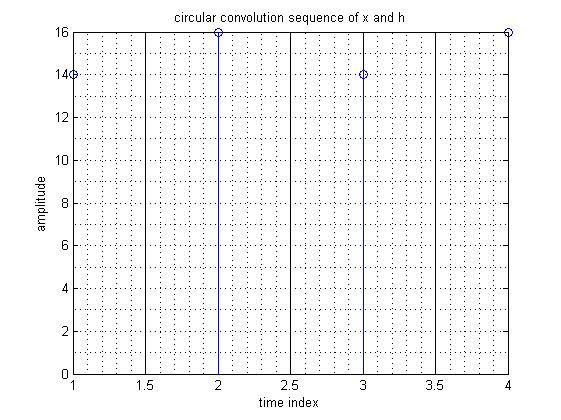
MATLAB PROGRAM FOR IMPLEMENTING CIRCULAR CONVOLUTION OF TWO SEQUENCES


function y=circular_convolution(x,h)
x= input ('enter the first sequence');
h= input ('enter the second sequence');
N1= length(x);
N2= length(h);
N=max(N1,N2);%length of sequence
x=[x zeros(1,N-N1)];  %modified first sequence
h=[h zeros(1,N-N2)];  %modified second sequence

for n=0:N-1;
    y(n+1)=0;
    for i=0:N-1
       j=mod(n-i,N);
       y(n+1)=y(n+1)+x(i+1)*h(j+1);  %shifting and adding
    end
end
%to display and plot circular convolution
n=1:N;
disp('output sequence of circular convolution');
disp(y);%to view output in command window
pause;
stem(n,y);%plotting circular convolution
grid minor;
xlabel('time index');
ylabel('amplitude');
title('circular convolution sequence of x and h');
 
 
OUTPUT WAVEFORM 
 

MATLAB PROGRAM FOR IMPLEMENTING THE COMPARISON OF LINEAR AND CIRCULAR CONVOLUTION


clear all;
close all;
x= input ('enter the first sequence');
h= input ('enter the second sequence');
N1= length(x);
N2= length(h);
x1=x;
h1=h;
x=[x zeros(1,N2-1)];  %modified first sequence
h=[h zeros(1,N1-1)];  %modified second sequence

for k=1:N1+N2-1;
    s=0;
    for j=1:k
       p(j)=h(j);
    end
    u=eye(k);
    v=flipud(u);
    m=(p)*(v);
    for i=1:k
        s=s+x(i)*m(i);
    end;
    d(k)=s;
end
disp(d);
subplot(211);
stem(d);
xlabel('time index');
ylabel('amplitude');
title('linear convolution');
%circular convolution
N=max(N1,N2);
x1=[x1 zeros(1,N-N1)];
h1=[h1 zeros(1,N-N2)];
z=x1';
for i=1:N-1
    k=x1(N);
    for i=N-1:-1:1;
        x1(i+1)=x1(i);
    end
x1(1)=k;
z=[z x1'];
end
m=z*h1';
disp(m);
subplot(212);
stem(m);
title('circular convolution');
xlabel('time');
ylabel('amplitude'); 
 
 OUTPUT WAVEFORM
 

MATLAB PROGRAM FOR IMPLEMENTING CHEBYSHEV HIGH PASS FILTER

%chebyshev HPF
%for specification
clear all;
alphap=input('pass band attenuation?=');
alphas=input('stop band attenuation in db?=');
wp=input('pass band frequency in rad?=');
ws=input('stop band frequency in rad?=');
%to find cuttoff freq and order of filter
[n,wn]=cheb1ord(wp/pi,ws/pi,alphap,alphas);
%system function of filter above expression
[b,a]=cheby1(n,alphap,wn,'high');
w=0:.01:pi;
[h,ph]=freqz(b,a,w);
m=abs(h);
an=angle(h);
subplot(221);
%plot the graph
plot(ph/pi,m);
grid;
ylabel('gain in db');
xlabel('normalisd frequency');
subplot(212);
plot(ph/pi,an);
grid;
ylabel('phase in rad');
xlabel('normalised frequency');
 
OUTPUT WAVEFORM


MATLAB PROGRAM FOR IMPLEMENTING CHEBYSHEV LOW PASS FILTER


%chebyshev LPF
% specification
clear all;
alphap=input('pass band attenuation?=');
alphas=input('stop band attenuation in db?=');
wp=input('pass band frq in rad=');
ws=input('stop band freq in rad=');
% find cut-off freq and order of filter
[n,wn]=cheb1ord(wp/pi,ws/pi,alphap,alphas);
%system function above
[b,a]=cheby1(n,alphap,wn);
w=0:.01:pi;
[h,ph]=freqz(b,a,w);m=20*log(abs(h));
an=angle(h);
subplot(221);
plot(ph/pi,m);
grid;
ylabel('gain in db');
xlabel('nor fre');
subplot(212);
plot(ph/pi,an);
grid;
ylabel('phase in rad');
xlabel('norm freq');
 
 
OUTPUT WAVEFORM


Friday, December 10, 2010

MATLAB PROGRAM FOR CROSS-CORRELATION (DIGITAL SIGNAL PROCESSING)


x1=input('Enter first seq=');
x2=input('Enter second seq=');
n1=length(x1);
n2=length(x2);
N=max(n1,n2);
%padding zeros at the end of smaller sequence
if n2>n1
    x1=[x1 zeros(1,N-n1)];
    x3=x2;x2=x1;x1=x3;
elseif (n1>n2)
    x2=[x2 zeros(1,N-n2)];
end
x3=x2;
y=[];
%shifting and multiplying
for n=1:N
    y(n)=0;
    for j=1:N
        y(n)=y(n)+x1(j)*x2(j);
    end
    x=x2(N);
   for i=N-1:-1:1%loop for shifting and adding zeros
       x2(i+1)=x2(i);
   end
   x2(1)=0;
   y(n)=y(n)/N
   
end
n=1:N; %plotting crosscorrelation output
disp('output seq of cross corr=');
disp(y);
pause;
stem(n,y);
grid on;
grid minor;
xlabel('time index n');
ylabel('amplitude y');
title('cross correlation of sequence x1 and x2');

MATLAB PROGRAM FOR AUTO-CORRELATION (DIGITAL SIGNAL PROCESSIING)


clear all;
x=input('enter the sequence x=');
N=length(x);
y=x;
z=x;
for i=1:N-1
    for i=N-1:-1:1
        x(i+1)=x(i);
    end
    x(1)=0;
    z=[z; x];
end;
m=[z]*[y'];
m=m/N
stem(m);
title('auto-correlation');
xlabel('time index');
ylabel('amplitude');